
Market volatility has returned in a significant way in 2025, driven by factors such as shifting trade policies, market concentration, and the fear and uncertainty that arise when investors face the unknown. While the news stories may change, the typical investor’s response remains the same when portfolio balances drop significantly: anxiety spikes, the desire for more information increases, and many feel compelled to take action to manage their stress.
After two strong years of stock market performance, many investors have been caught off guard by how quickly markets can turn downward when new developments emerge. This year has served as a reminder that successful investing requires a clear understanding of what you own, why you own it, and when you'll need it. Without a solid plan, interpreting current events can become overwhelming.
However, there’s an encouraging trend that’s emerged in 2025: diversification. Investors who have embraced diversification have been better equipped to manage market volatility. We are once again reminded of the importance of not putting all our eggs in one basket, and that chasing short-term performance is not a sustainable long-term strategy.
To help navigate this period of market volatility, I’ve gathered five charts from various sources that I believe offer valuable insights. Below each chart, I’ll share my key observations to keep things clear and to the point.
Several of these charts use the S&P 500 for their data and analysis due to the wealth of information it provides. Please note, however, that my use of this data does not imply I’m recommending the S&P 500 as part of your investment strategy. This article is meant for educational purposes and should not be construed as specific investment advice regarding any index.
Additionally, I want to clarify that the charts presented are not endorsements of any particular investment firm or model. There is a vast array of market data and insights available, and in this case, I found the visuals shared by these investment companies to be particularly helpful. I’m grateful for their contributions and happy to use them to provide valuable insight. Our firm’s independent structure allows us to look across the industry and select the tools and insights that best serve the needs of our clients.
If you’d like assistance in building a thoughtful plan to better understand and manage market volatility, a qualified investment professional can help. Please don’t hesitate to contact us to schedule a review of your plan.
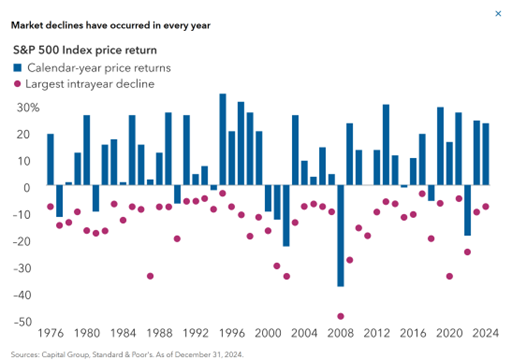
Chart 1 – Intra Year Declines
Observations:
· Investing in stocks is not for the faint of heart. This historical chart of the S&P 500 shows intra year losses that occurred in a year compared to year end performance from 1976 to 2024.
· Intra year volatility is normal, and not necessarily an indicator of how your portfolio will perform over the long term.
· If you are a long-term investor you should internalize this chart, and remember that losses are to be expected, but in many cases do not define how the year will end
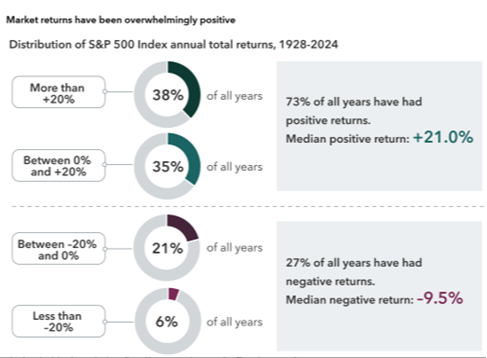
Chart 2 – A Historical View of the Market
Observations:
· There is no shortage of historical events over the last 96 years that would have made even the steadiest investor question their investment plan. Depressions, recessions, wars, assassinations, inflation, civil unrest, global pandemics, etc. have all been part of this 96 year sample.
· The stock market has shown resilience, and has been positive more often than it has been negative
· Historically long term investors have been rewarded for taking stock market risk.
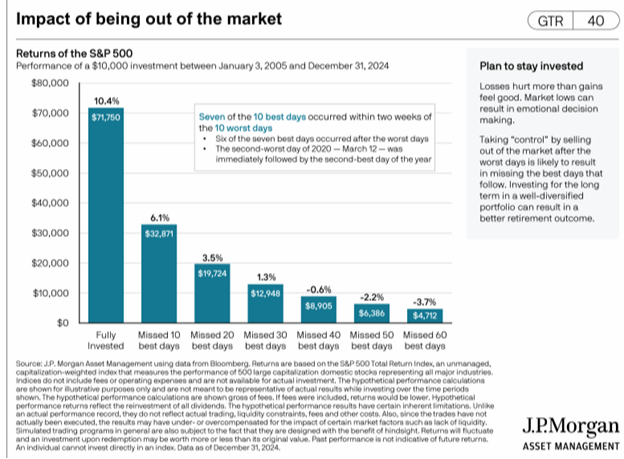
Chart 3 – Market Timing Typically Does Not Work
Observations:
· This chart illustrates how an investor would have performed if they stayed invested in the S and P 500 between 2005 and 2024.
· The stock market can move very quickly. It may feel good to take control of your portfolio if you are anxious during periods of volatility, sell your investments, and sit on the sideline until things cool off. Unfortunately it’s very hard to time when the market will recover, and the cost for being on the sidelines to your performance can be significant.
· You need to know what you own, why you own it, and when you will use it to better help you understand when it makes sense to make changes to your portfolio.
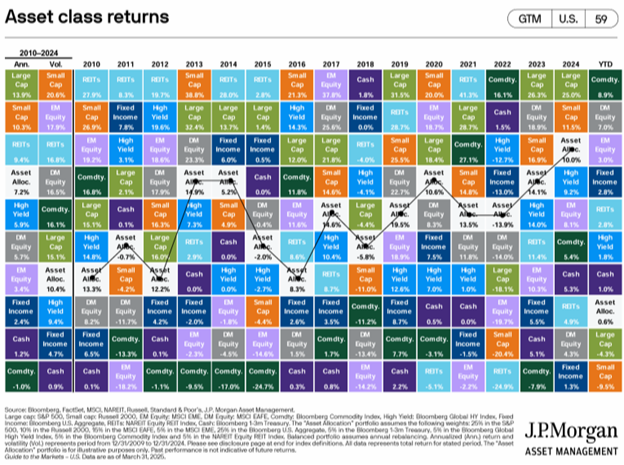
Chart 4 – Diversification Matters
Observations:
· This chart illustrates how various asset classes have performed from 2010 – 2024. The gray box titled “Asset Alloc.” Illustrates a diversified investment portfolio.
· Diversification paired with rebalancing your portfolio as your investments fluctuate can be helpful in managing market volatility.
· We must avoid the temptation to only chase the winner each year, and maintain a diversified portfolio to avoid unnecessary risks in our investment portfolios.
· We must also acknowledge that when an investor is diversified there may be discrepancies in their performance compared to what is reported in most news cycles.
Chart 5 – Develop a Retirement Distribution Plan
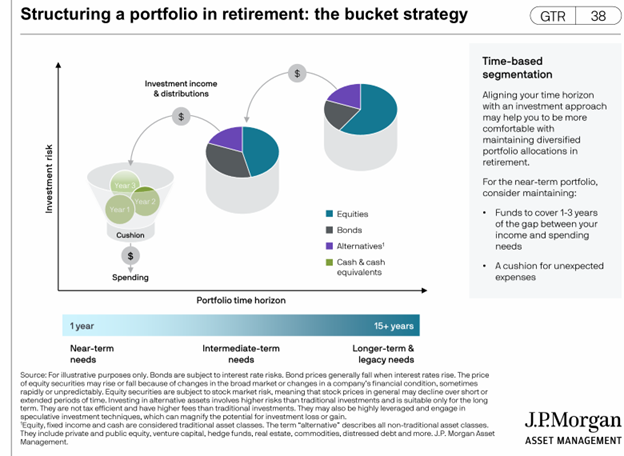
Observations:
· If you are nearing retirement you need to develop a retirement distribution plan that works in tandem with your investment plan. This plan should spell out how you will sell your investments to cover your living needs.
· This illustration is demonstrating an approach many people take to manage distribution risk in their investment portfolio as they approach retirement. The general concept is that you earmark your investments and their risk profile according to when you will need those dollars.
· In this approach near-term investments that will be used to fund your retirement should be conservative in nature, and not exposed to stock-market risk
· In this approach as your time horizon increases so too does your risk profile, so that you can increase the probability of growing your investments to replace what is being spent.
· I have used this concept many times to help my clients plan their retirement investment plan, and have found it to be very helpful in easing market anxiety.
· I’ve found taking a bucket approach can calm an investor when they understand that they have time for their growth-oriented investments to recover, because they have earmarked conservative investments for their more immediate needs
Disclosures:
Securities and advisory services offered through LPL Financial, a registered investment advisor, Member FINRA/SIPC.
The opinions voiced in this material are for general information only and are not intended to provide specific advice or recommendations for any individual. All performance referenced is historical and is no guarantee of future results. All indices are unmanaged and may not be invested into directly.
Rebalancing a portfolio may cause investors to incur tax liabilities and/or transaction costs and does not assure a profit or protect against a loss.
This information is not intended to be a substitute for specific individualized tax or legal advice. We suggest that you discuss your specific situation with a qualified tax or legal advisor.
The Standard & Poor’s 500 Index is a capitalization weighted index of 500 stocks designed to measure performance of the broad domestic economy through changes in the aggregate market value of 500 stocks representing all major industries.
There is no guarantee that a diversified portfolio will enhance overall returns or outperform a non-diversified portfolio. Diversification does not protect against market risk.
No strategy assures success or protects against loss.